New Contours of Crisis: Shaping Retreat and Resettlement in the Northeast
by George Gard (MAUD ’14)
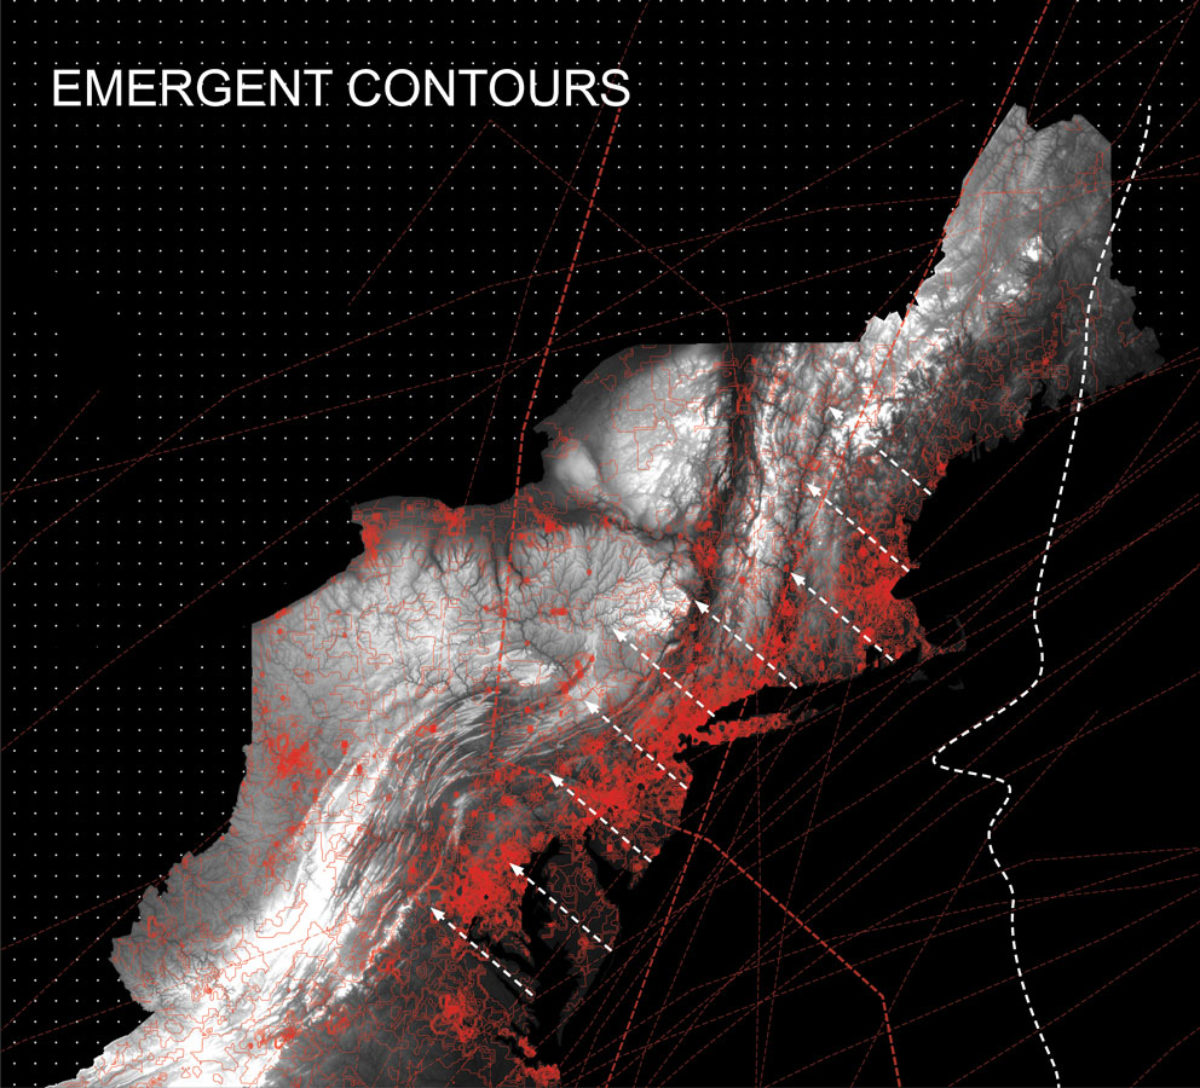
New data, recent experiences, and coastal scholars have shown that the vulnerability at the coast, particularly in the northeast of the United States, has never been clearer. While topography and its intersection with anthropogenic climate change (increased rain events, rising sea levels, and increased hurricane events with associated storm surge) is critical this is not the whole picture. Because this method of analysis places focus solely on the land contour the risk adaptation is only considered at the edge. Ultimately, this creates a condition in which land is seen as universally defensible. Increasingly, there is an understanding that not all places can be defended for all time. As this reality confronts the more populated areas of the northeast of the United States, it ceases to be solely a question of the land contour, but also its intersection with contours of wealth and density. Further, as these contours become emergent horizontal contours of retreat, it is no longer just a question of the edge but of inland regions and receiver cities.
Density has the most direct effect on this, though it is a paradoxical intersection. In one sense population density produces the crisis. However, as density increases defense becomes further justified.
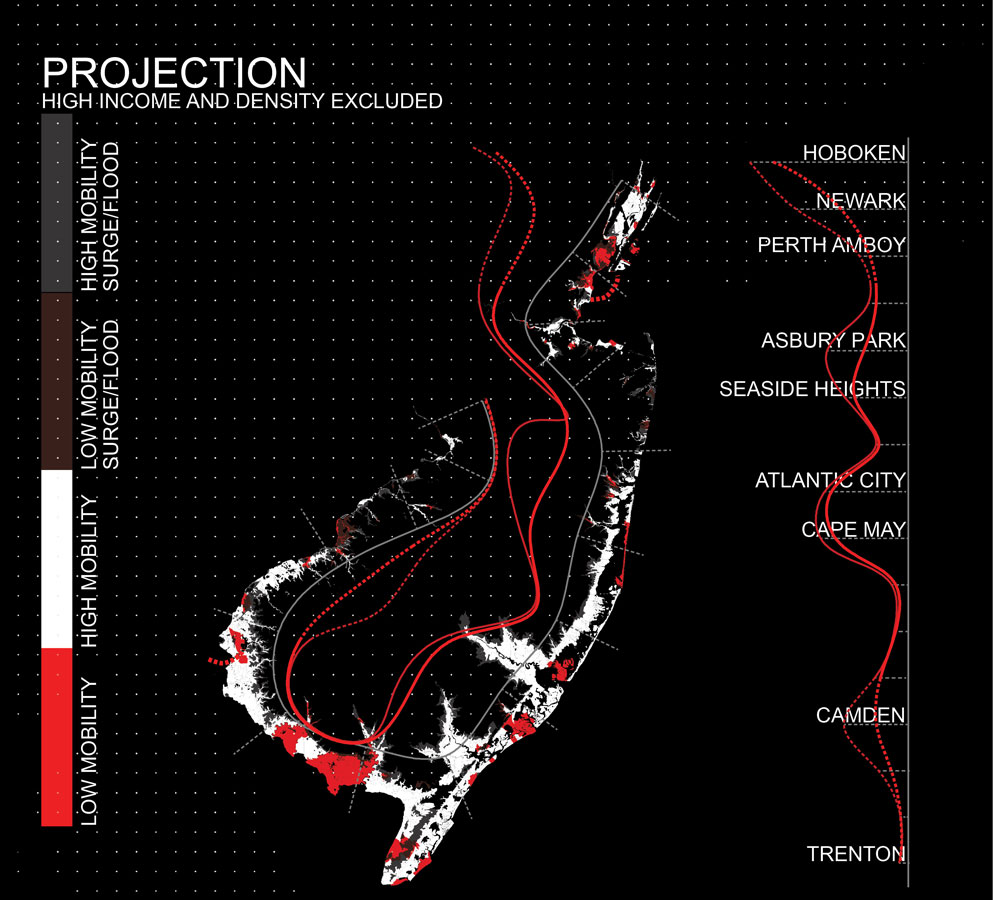
Income is even further complicated, as it is more spatially dispersed than population. Of the US communities planning for sea level rise and increased storms, wealth has proven more apt to defend, while economically less advantaged populations have little means to defend but are also less able to move.
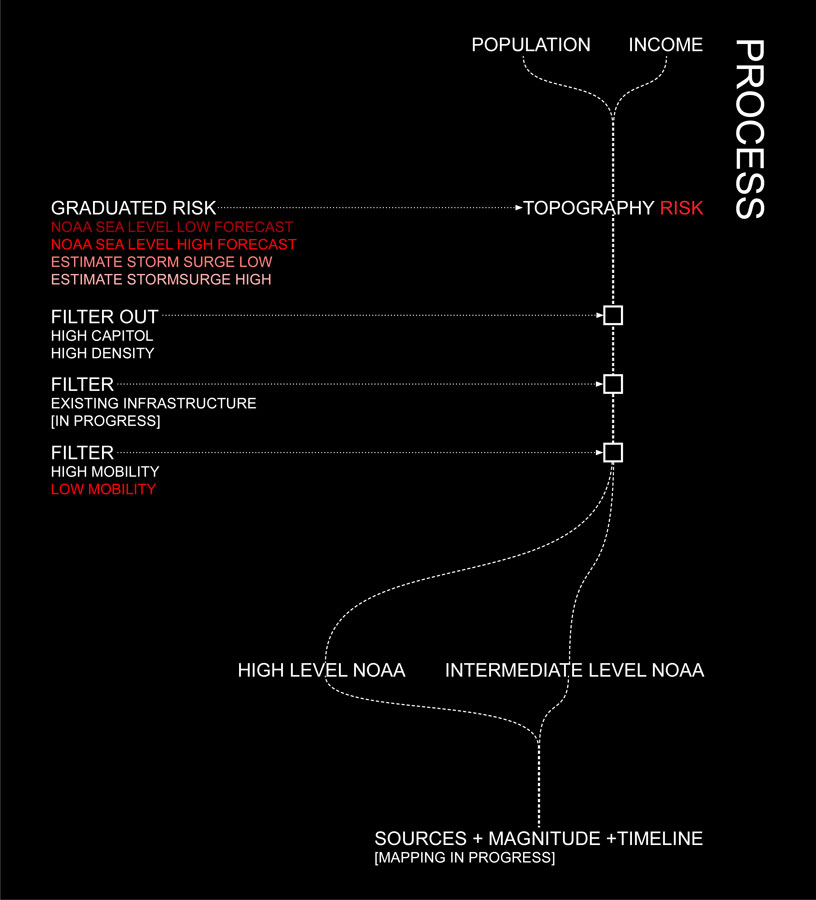
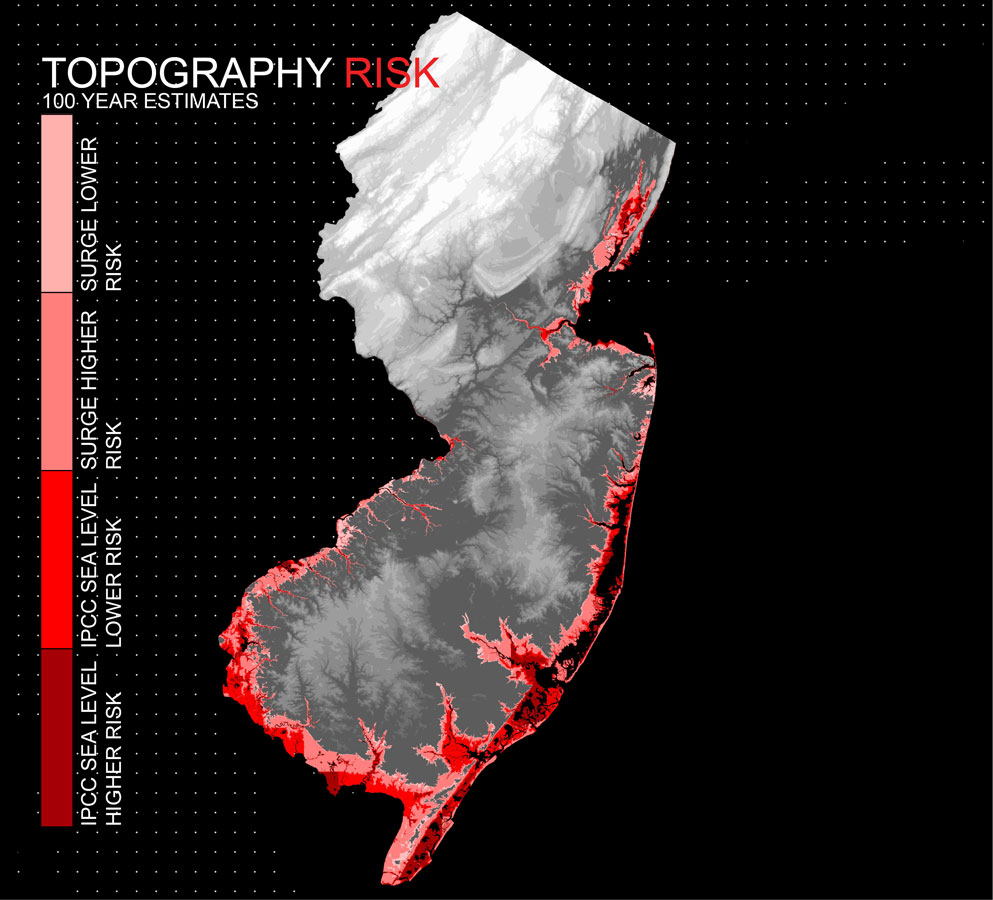
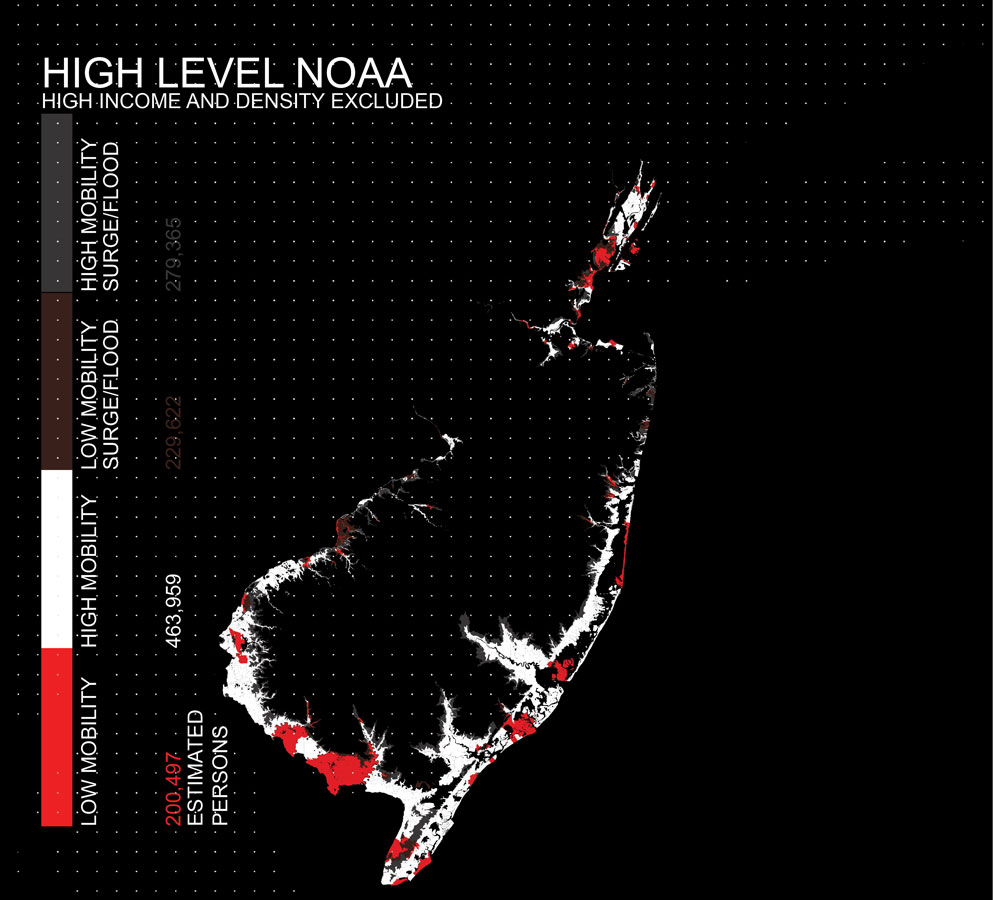
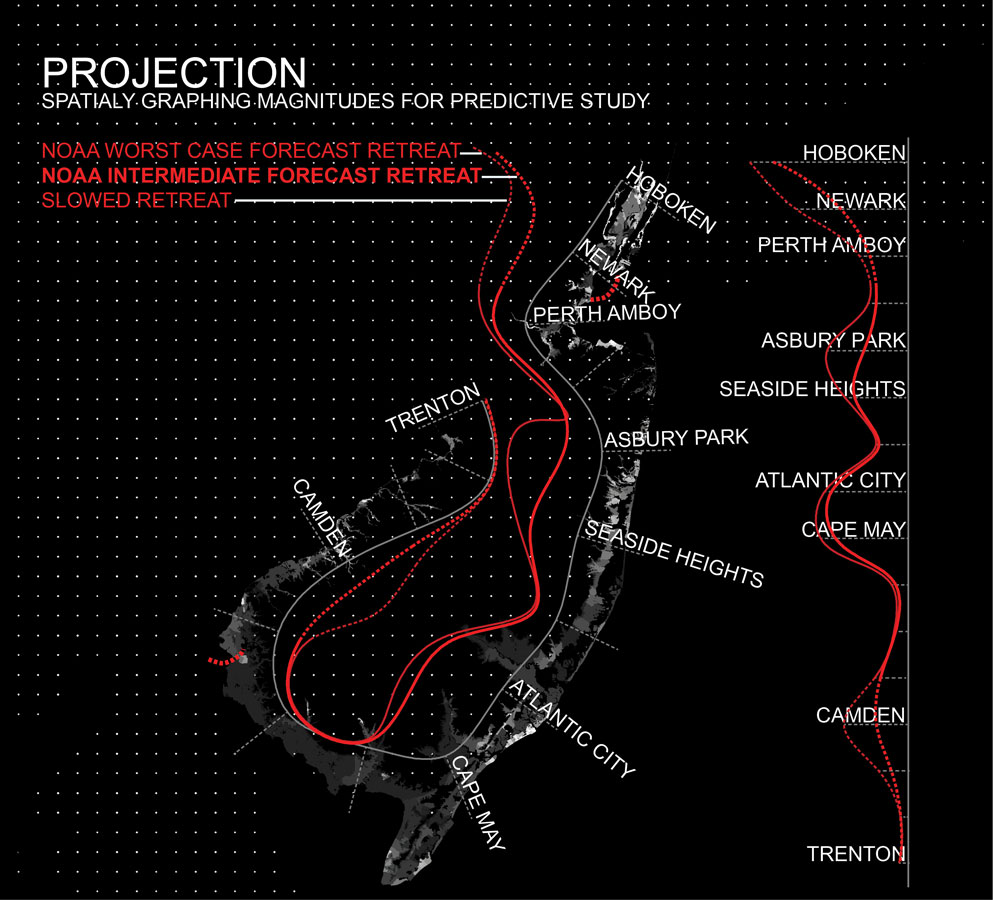
In order to better understand the magnitude of potential migration, this project is primarily a mapping study bringing together density and income data from the US Census, high-resolution topography data from various entities, and NOAA forecasts for the next 100 years. The initial series of maps diagram this possibility at the scale of the Northeast of the US. To consider the effort in more detail the scale drops to consider New Jersey, but would still be applicable at the large scale.
These maps contrapose the data as diagrammed in the flow chart to generate magnitudes of retreat in this context. Initial thresholds of wealth have been set based on relative data at over $100,000 median income and above 12,000 p/sqmi for likely to defend (vertical retreat, walls, etc.) in high areas of risk. In lower levels of risk this is reduced to $75,000 and 10,000p/sqmi. Further, below $50,000 median income is indicated in red on the final maps as likely needing further assistance (with those least advantaged needing even further subsidy). These are not intended to be absolute numbers but rather as part of the relevant factors for scenario planning which could be adjusted to produce new results, and potentially be automated.
This creates a visual and quantifiable tool both for retreat planning as well as for identification of areas of prolonged defense. Current work is focused on characterizing the communities involved in retreat to better identify concepts for planning relocation. Further, data is being collected to consider infrastructure and other factors that could be added to the spatial model in the same framework and used by others. Further, finer grain study will allow for a clear picture of paths and timeline of migration. This research connects to a larger study of receiver cities of potential retreat and their potential responsive to protracted migration and equity. This larger project ultimately posits the temporal scale as the most important factor.
Maps were created using ArcGIS® software by Esri. ArcGIS® and ArcMap™ are the intellectual property of Esri and are used herein under license. Copyright © Esri. All rights reserved. As Well as Rhinoceros and Grasshopper used Herein under license. Data Sources: FEMA, Social Explorer, ArcGIS, Tiger/LINE US Census, NJDEP, IPCC.