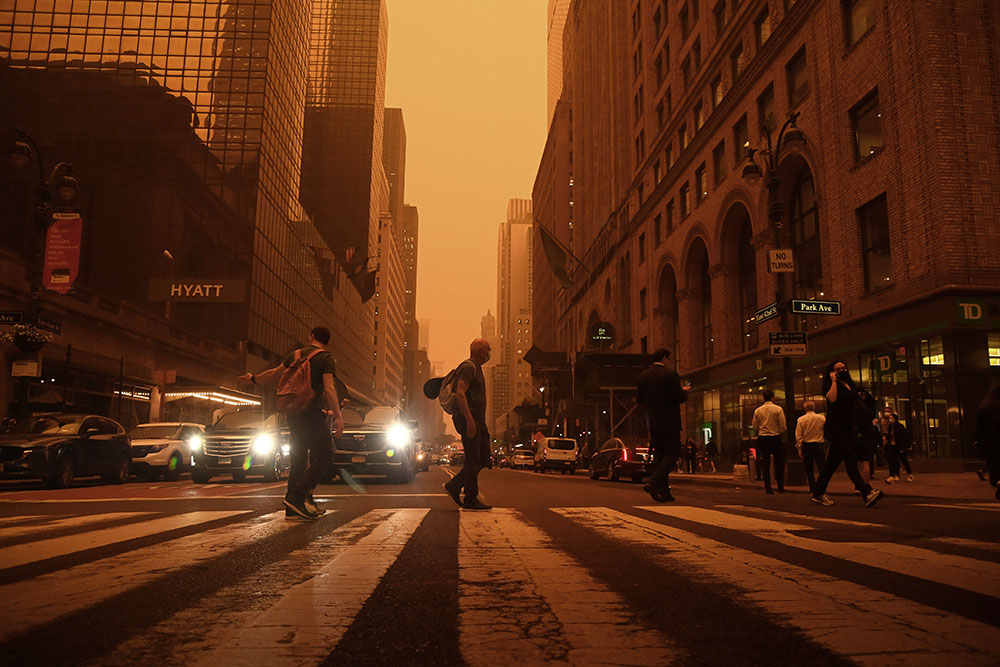
In an exhibition at the Frances Loeb Library, Craig Douglas, assistant professor of Landscape Architecture, explores one of the elements we most often take for granted: the air we breathe. An unconscious process, breathing is the one thing we can’t go without for longer than a few moments. In “Digital Air” (through March 16), Douglas renders the invisible visible, with photographs of the more than one hundred people around the world who gathered air samples at his request, a collection of books that contextualize his theories for designing with air, images of artworks that have engaged with concepts of air as matter, and a video that layers Giambattista Nolli’s 1748 “La Pianta Grande di Roma” (“Map of Rome”) with Douglas’s map of the city’s “geometries of air.”

The exhibition, Douglas writes, “claims air as matter by digitally reconceptualizing it as a material that is both corporeal and technological,” and asks us to consider how air can inform our understanding of the past, as well as current health conditions and our environmental future. Most importantly, it helps us to envision air as a physical component of the designed world, with its own topographical forms and ever-changing systems, shedding light on a new framework for structures and landscapes.

Rachel May: You asked people at different locations to collect air samples in glass vials at the same moment. What was significant about the time when this collection occurred?
Craig Douglas: All the air in the vials was collected at the exact time of the December solstice, which in Cambridge was 4:20 AM. Here, we call it the winter solstice and it’s the shortest day of the year, but, obviously, in the Southern Hemisphere, it’s the summer solstice and the longest day. It was an interesting time to recognize—not so much a cultural event, but a cosmic one. It fit in nicely with the idea of air as a cosmic atmosphere.
I received air samples from nearly a hundred places around the globe taken at exactly the same time, partly to illustrate the differences across the world and what they might mean. How different are each of these places through the matter of air itself?
RM: When you’re measuring the samples, can you tell the temperature at which they were taken?
CD: I asked people to use their local apps to record data, including temperature, humidity, and air pressure, which they shared with me. I used a range of other websites to collect other data, which includes levels of carbon monoxide, PM2.5, PM10, sulfur dioxide, and nitrogen dioxide, which are the more problematic matters.

RM: The contaminants.
CD: Yes, they describe back to us the health condition of the air. On the windows of the library, you see the collection of air samples. But also displayed on the windows are chemical symbols and formulas for what actually composes the air. These symbols give air another nomenclature, in another form of media.
RM: Is that part of your motivation to collect air samples, to measure the health of a system or place?
CD: It is. Air is invisible, and, therefore, it often escapes our consciousness. Our breathing is automatic. We don’t think about it. But, air sustains our lives. Air is the thing that we can’t go without for the least amount of time. Including the samples of air from all around the world in the exhibition describes back to us that, yes, air is invisible, but each sample actually contains very different substances. Air varies as a matter. It has a material composition that affects everything around us. So, then, how can we then think about air in architecture—a medium that we design with and through?
RM: Is this map derived from the collection?

CD: These images combined to form a world map, which is perhaps less distinguishable because what I’m mapping is all of the air qualities on December 22, the solstice. I’m mapping the global condition on that day. The colored sections move from pinks to blues, where conditions are hazardous. I’m trying to redescribe the earth through the architecture of air at this global scale.
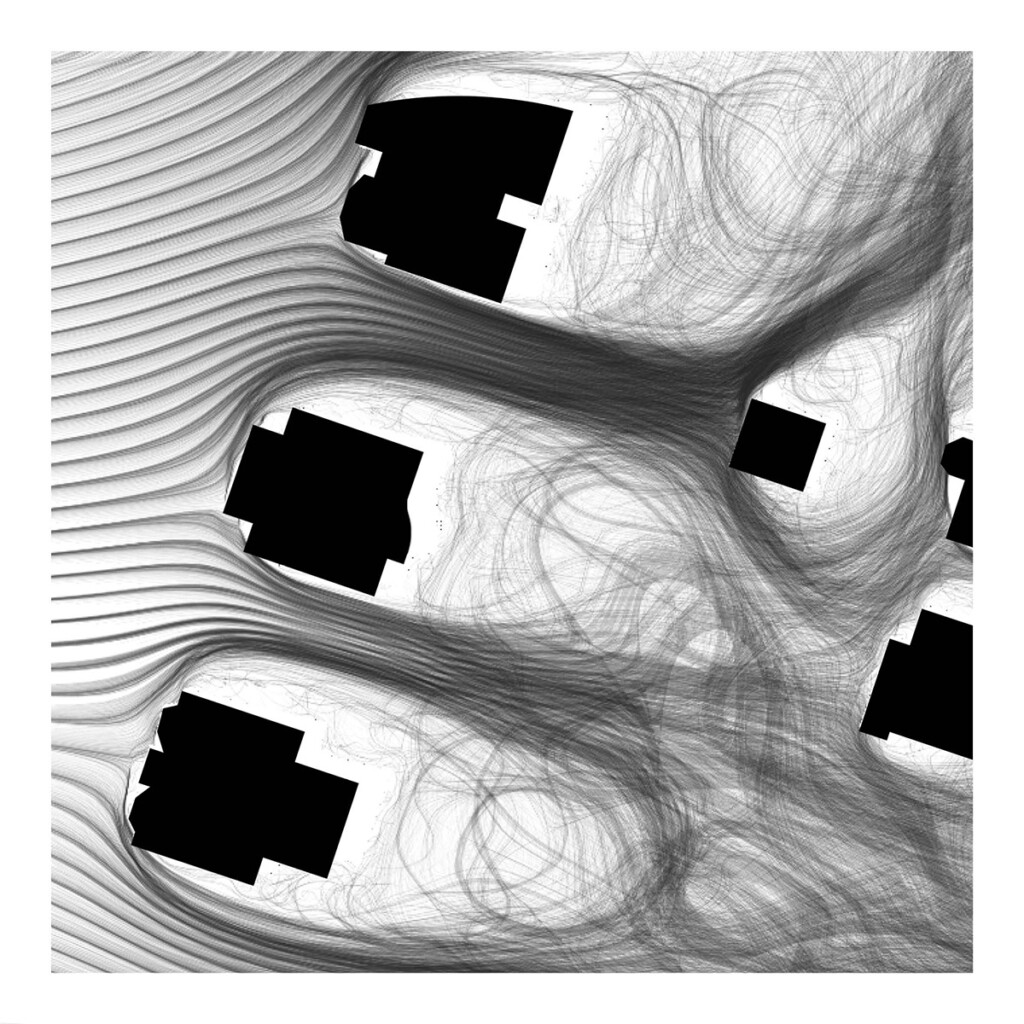
The film presented in the exhibition focuses on the Piazza Minerva, in Rome, and how air movement informs the quality of the space. I simulate this air movement through a range of different criteria. Sometimes, the air is visualized as points, which might be defined as particles or smoke or haze. Sometimes, the air takes the form of threads or lines conveying speed and trajectory.
RM: Is there an existing technology that gathered this data, or did you create technology to collect it?
CD: We created them all. What you see in the background is the [Giambattista] Nolli map, a 1748 map of the city of Rome. It’s the first accurate mapping of the city. This was part of the impetus for my fellowship at the American Academy in Rome. I was looking at the conventional mapping of Rome and trying to understand the city in terms of a figure-ground relationship.
The map describes the built environment as figure (black) and ground (white)—the positive is black, the void is white. As such, it describes the white as uncomplicated, unproblematic, and devoid of our attention. I’m turning that around and suggesting that, in fact, it’s a very important space. My study looks at how air forms that space. This image gives us a new drawing, a new understanding of the composition of the city through the construct of air.

RM: The way the air moves is beautiful.
CD: If we go back to the front of the gallery, to look at precedents that have gone before, you’ll see I studied Hans Haake’s Condensation Cube (1963–1967). It’s a clear Plexiglas cube in a gallery inside of which is a contained amount of air and a very small amount of water. It’s not a static object. It’s always changing, based on the heat in the room, how many people are present, how much sunlight might fall onto it, or the air conditioning—it’s continually changing. Air is no longer just a natural and invisible thing, but we as humans are very much part of its making and its continued transformation.
There’s a range of other precedents, for example, Étienne-Jules Marey was fascinated with making the invisible visible with air tunnel tests and smoke, which we’re quite familiar with today because we understand that, for example, the way the wing of a plane works is with updraft, making the air move more more quickly over the top so that you get a vacuum that gives you lift. These things are well-known now, but this work was astounding at the time.

Returning to the film at the back, I’ve taken this idea of the figure/ ground of Nolli and used his map, that sometimes you see appear and disappear into the background in the film, to bring to bear another reading of the city through the matter of air, or the architecture of air. We see the perception of air in the city as an interconnected fluid space, rather than the Nolli map, which describes it as a static condition of positive and negative space.
RM: How does this influence how you think about design and the work you’re making now?
CD: Conceiving of air as matter sets the stage for design. How can we consider or approach the design of the city or of spaces— the network of spaces—by considering air? Does that mean, then, that the landscape needs to be operable? Do we move elements around continually throughout the year to direct air?
Or, does it mean considering vegetation? For example, plants lose their leaves in the winter, which has a very different effect on the airflow outside—as well as the fact that the trees are part of the filtering process. Happily for us, they generate oxygen as a byproduct.

We might reconsider the landscape of the city or the city as a landscape by thinking about air and engaging with it as an operable condition. For instance, in Boston, we have a prevailing wind from one direction in the summer and another direction in the winter. So, when you see the Nolli map videos, this first series comes from an easterly direction. The next chapter of the video shows us the northerly wind, the westerly wind, and the southerly wind, and how these conditions dramatically change.
Our cities are already 2 to 3 degrees Celsius warmer than the surrounding countryside. The composition of the urban fabric captures contaminants and hotter air that affect our lives. Part of what we’re trying to map here is: Where are those air flows quicker? Where are they slower? Where could contaminants potentially get caught and trapped? And then, how does that impact our living spaces? How does it impact how we engage in these spaces? How are these qualities also then permeating into the interiors of the buildings? You can easily make the connection between the outside and the inside space, as well.

RM: How are you integrating this into your work with students?
CD: Last fall, I ran an incredible seminar about exploring atmospheric encounters, visualizing the invisible. I asked each of the students to select one element of the air—humidity, temperature, radiation. We then built digital sensors called sentinels using Arduino technology to measure that particular quality.
I also asked the students to visualize that data in real time. They would receive a digital readout telling them, for example, how much radiation is in this space at this particular time. They were able to take that data and redraw the landscape as an airborne condition. This was quite wonderful because now people are thinking about the landscape, the space that we live in, as a process rather than a static form.

Last year, I also ran an option studio in which we looked at how to redesign with air. How does air have a cultural impact, a social impact? What conditions might we be address with that information? Students looked at specific air conditions in San Juan, Puerto Rico, and then designed with those conditions. There are specific cultural and political conditions that play out that that make many things unusual, so it offered an interesting case study by which to pursue this idea.